Educational Consultancy
Qualitative & Quantitative Researcher
Our client, a Chicago-based consultancy, provides professional guidance to school administrators and teachers on improving student learning experiences. Their staff has decades of experience and education giving the organization clarity and confidence in its ability to provide reliable services. However, they desired to learn more about their customers so that they could tailor their approach and offerings to that of what was most needed in the education industry. In a nutshell, they were looking to build their business through closer alignment of their resources with industry demand.

What We Did
Learned the Domain
Education systems are highly structured and mandated by many levels of government. Therefore, the first step of our approach was to familiarize ourselves with the domain by studying official regulations and processes governing interactions between teaching professionals and students. After gaining a deep understanding of this information as it related to our client’s business, we structured and conducted qualitative research in which we interviewed key company stakeholders, teaching administrators, teachers, and other education professionals regarding their experiences with students. One of our goals with this research was to compile data from the population we were studying in an attempt to identify any trends and/or overarching themes that would impact our comprehension of current successes and pain-points of teaching interactions. The findings and analysis from the qualitative research served as the framework for planning our quantitative research activities.

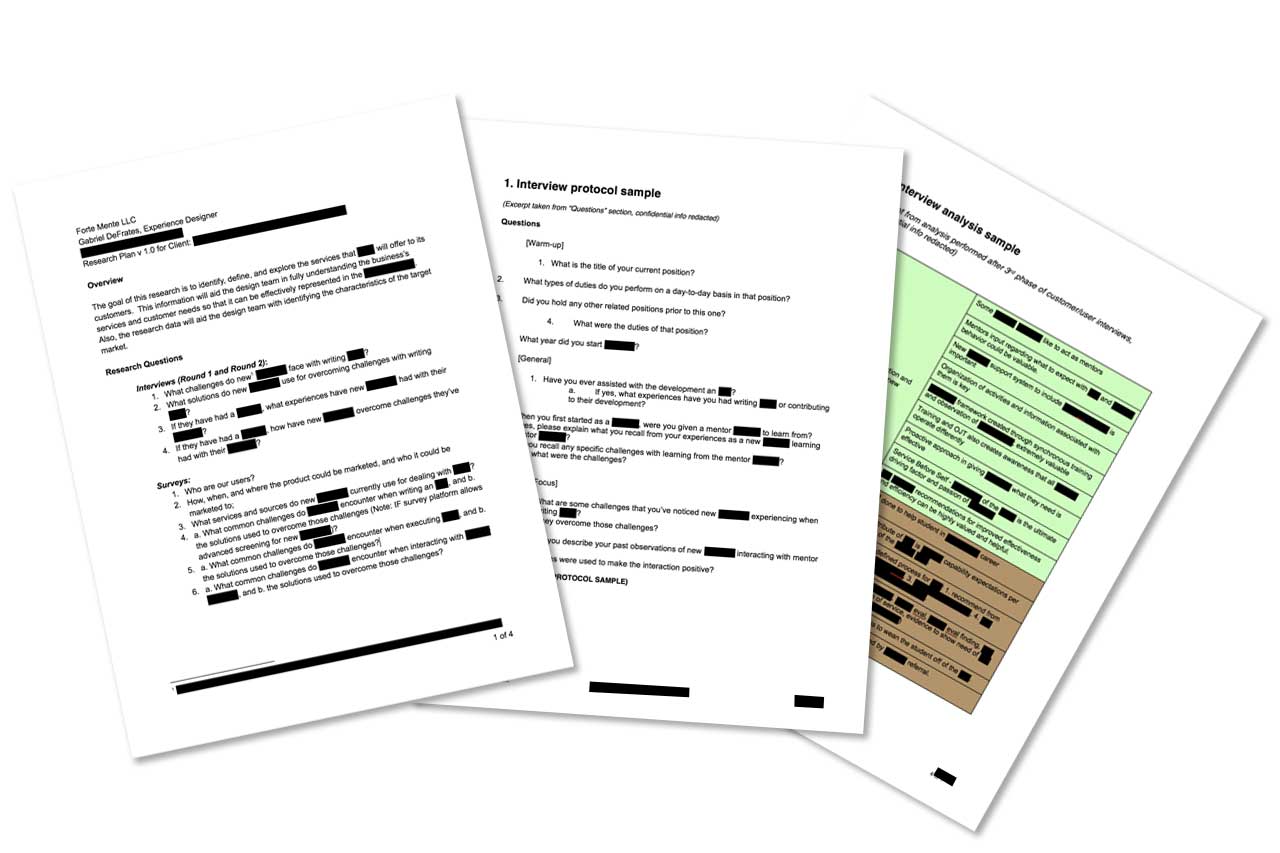
Figure 1.0. Redacted samples of Research Questions, Interview Protocol, and Data Analysis.
Surveyed the Population
Reflecting on the interview data, we crafted a survey and used SurveyMonkey to send it out to teaching professionals across the United States. We geared the survey questions toward acquiring demographic, sentiment, and behavioral data relative to past teaching experiences. The responses and analysis we gained from this round of research was instrumental in allowing us to validate and invalidate our prior perceptions of the population. Most importantly, we were able distinguish significant relationships and trends within the data that were relevant to our study and would impact the recommendations we would make to our client.
Figure 2.0. Redacted sample of the first iteration of Survey Plan questions.
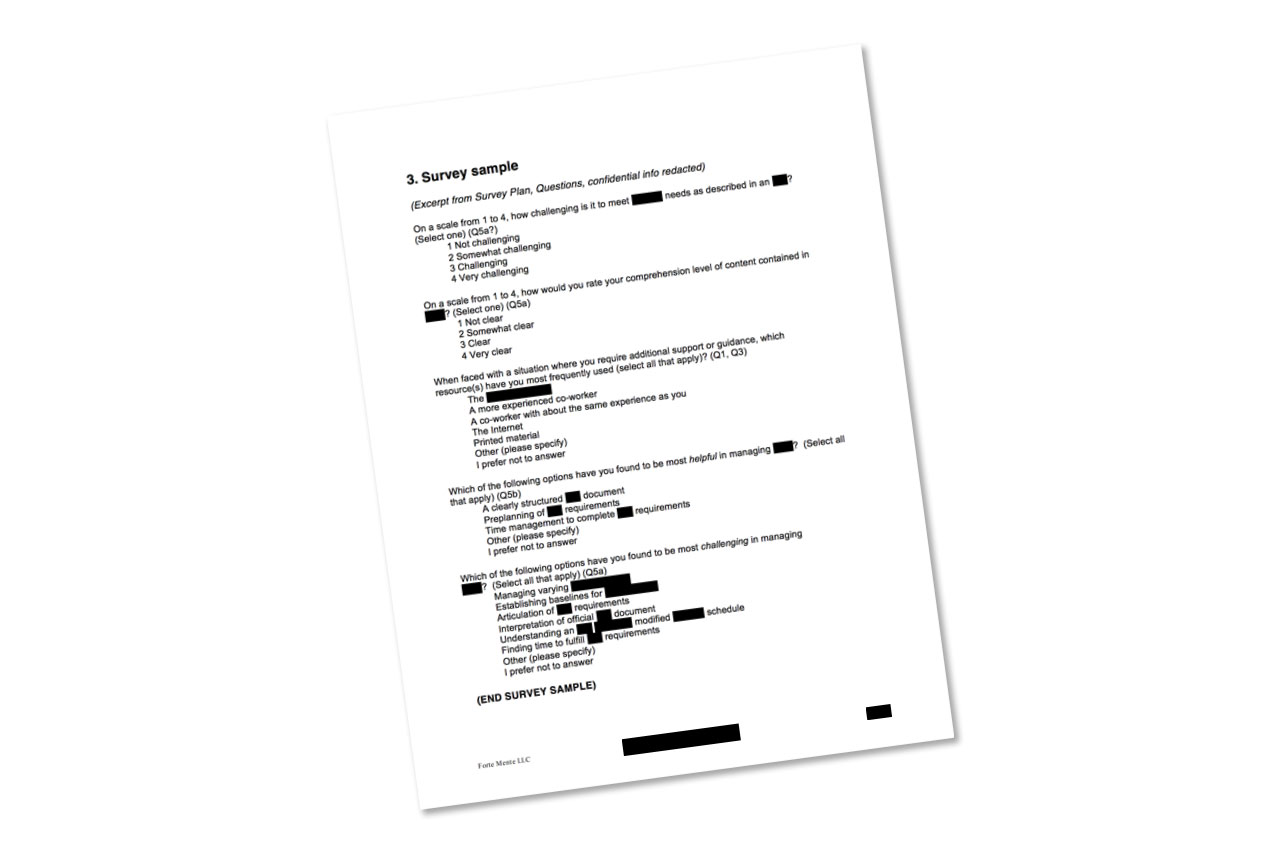
Figure 3.0. Redacted sample of digital survey question built in SurveyMonkey.
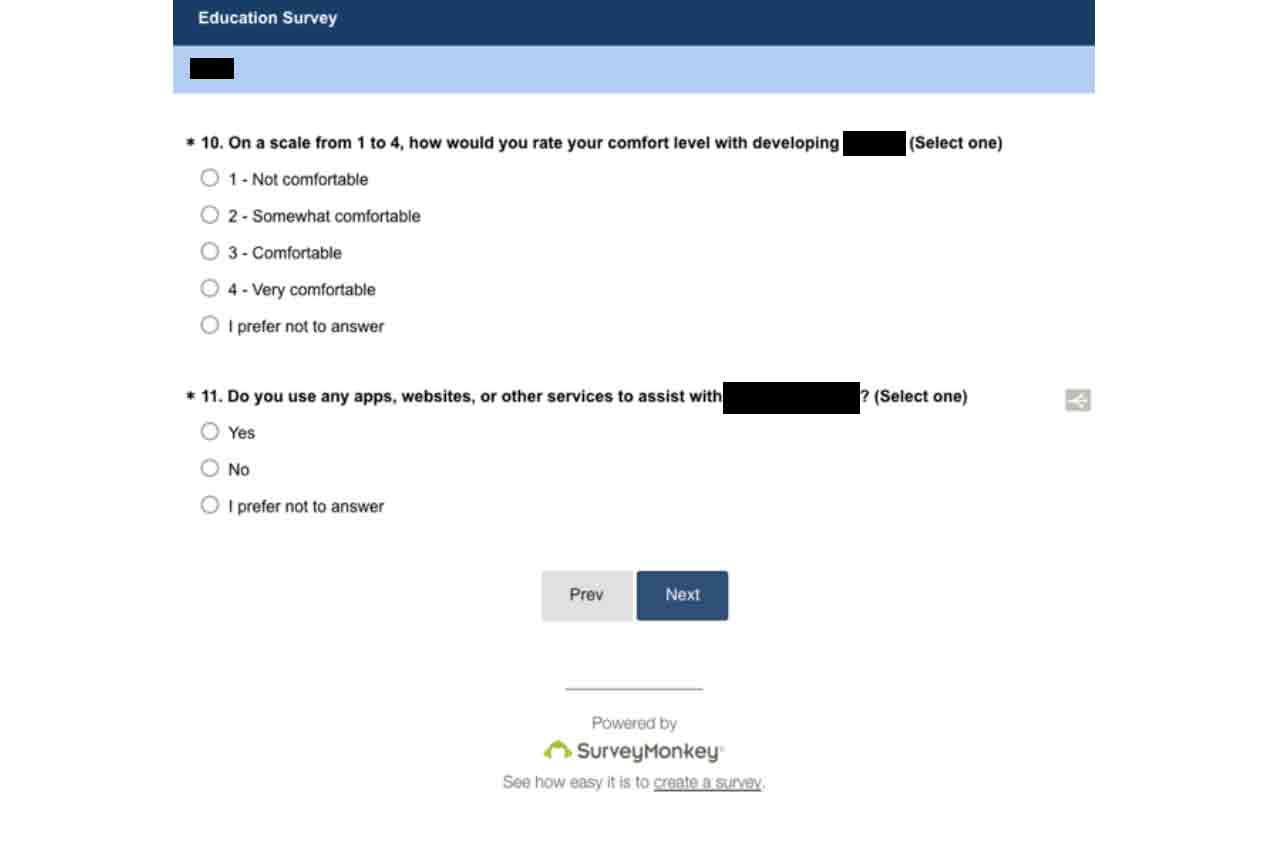
Figure 4.0. Redacted sample of the SurveyMonkey results and data analysis.
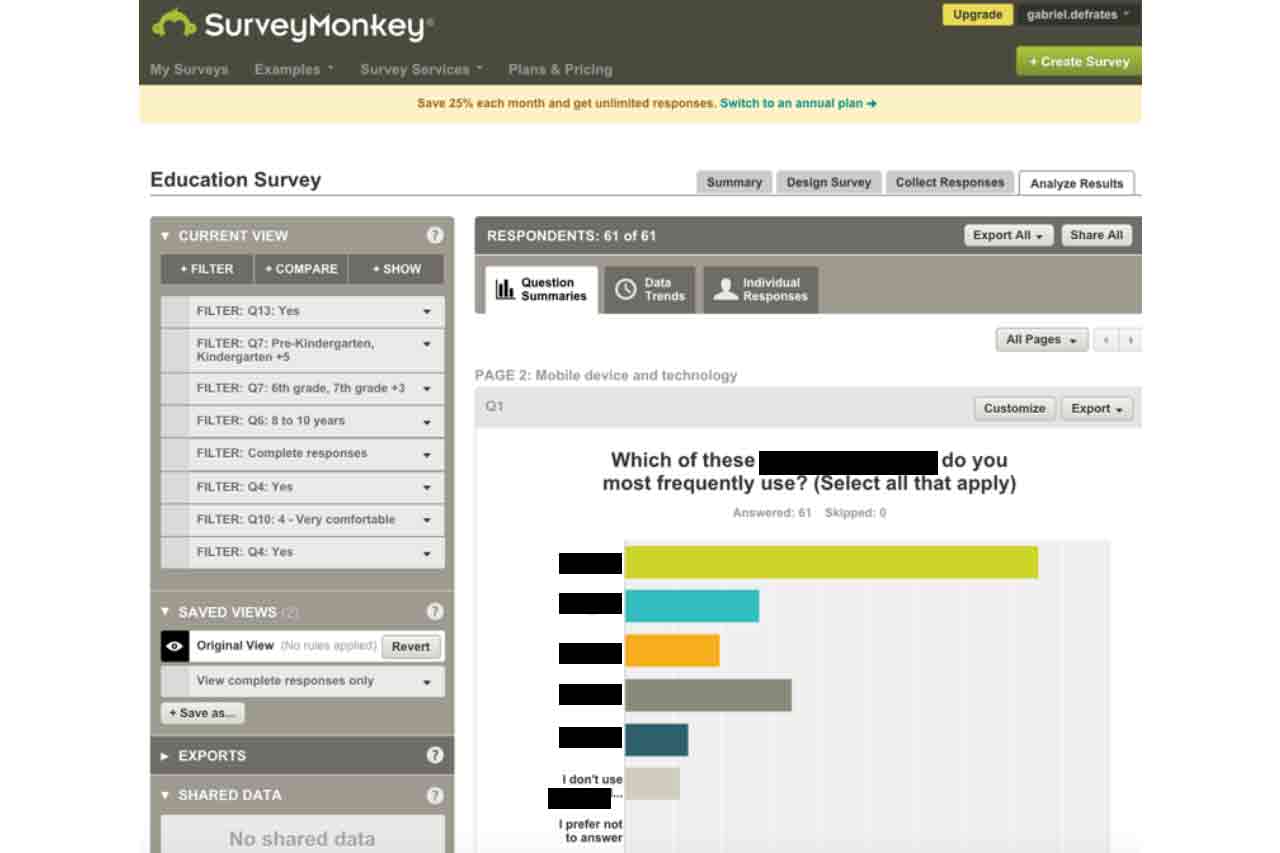
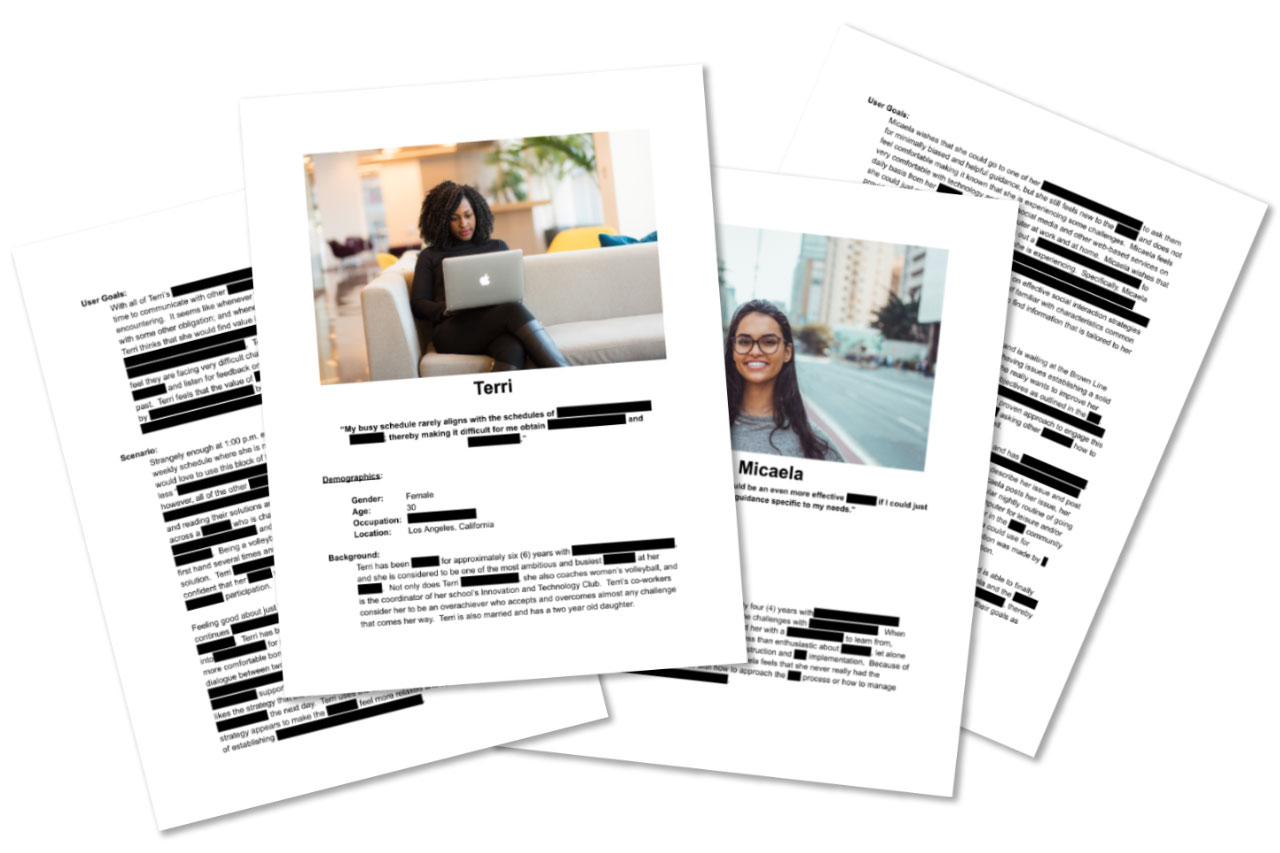
Figure 5.0. Redacted samples of research-based personas, Terri and Micaela, who represent our client’s targeted users.
Results/ROI
Refined Service Model
Based on the findings of the research, we developed an optimized service model by which our client makes its services available to its customers. Our client’s stakeholders believe that this new process is more efficient in that more of its valuable resources can be dedicated to its customers without any actual additional depletion of resources from our client. Likewise, the approach has since proven to be valuable to not only our client’s customers, but also to the organization as a whole.
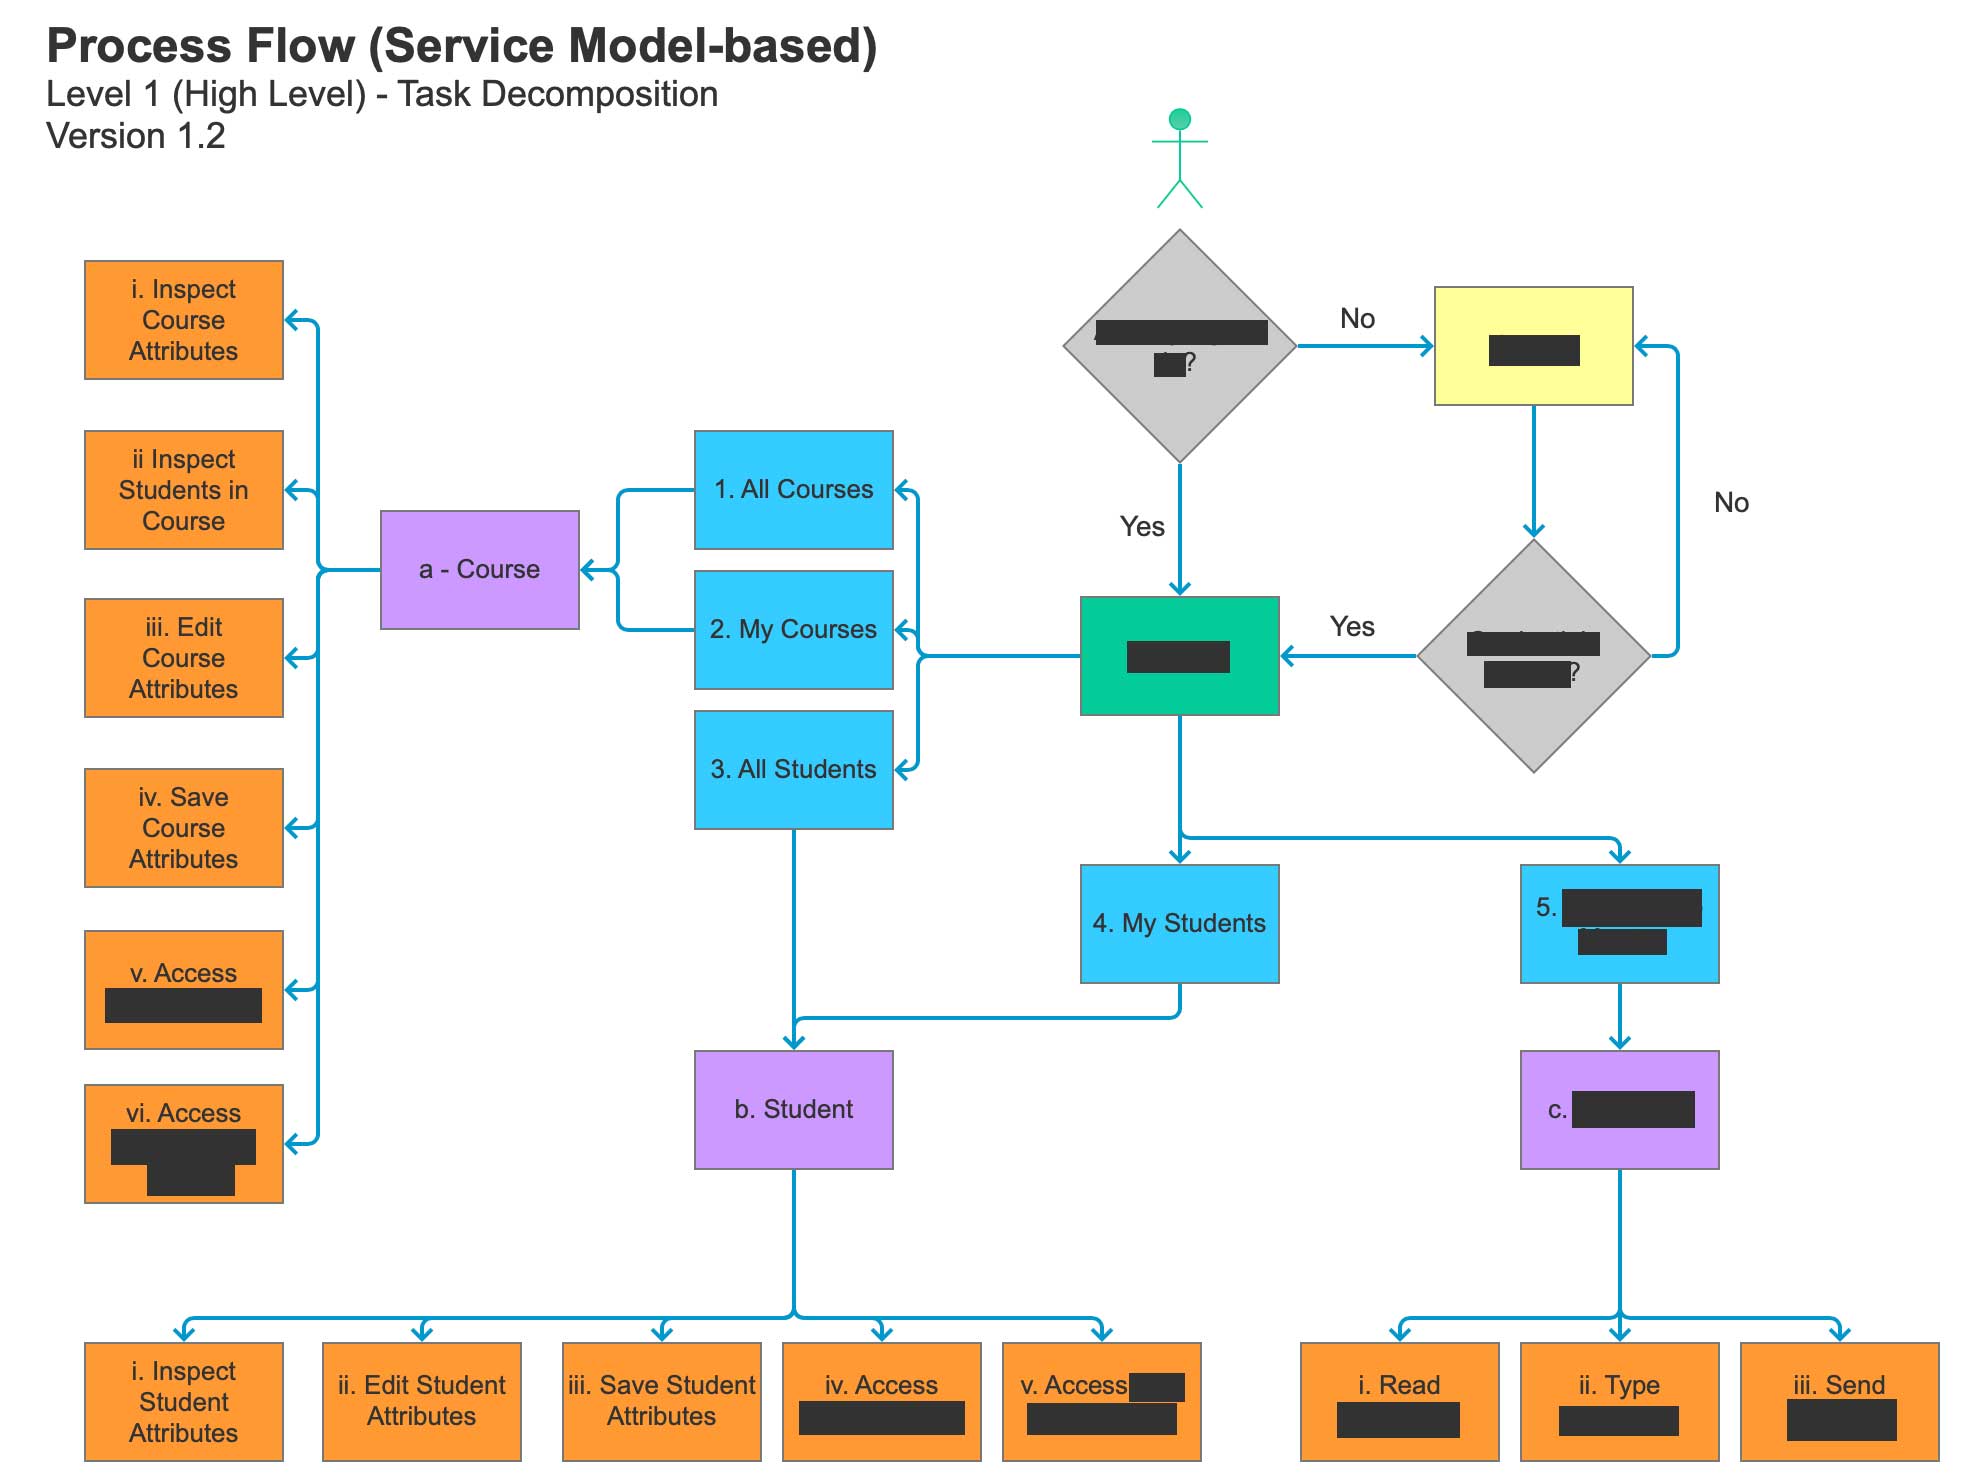
Figure 6.0. Redacted sample of Service Model-based Process Flow showing an early iteration of high-level task decomposition.
Alignment of Resources with Demand
Additionally, the research data gave us the ability to redesign several of our client’s services to more closely align with the needs of its customers. Our client has reported that this adjustment alone has positively impacted retention and revenue. Finally, the research shed light on the demographics, feelings, and behaviors of our client’s potential customers. With this information, we assisted our client with building focused marketing campaigns served via various channels to generate substantial leads and conversions.

Activity Breakdown
Reflecting on this project as a whole, we completed work in the following areas: Documentation Review, Interviews, Surveys, Competitive Analysis, and Data Presentation. We’ve divided up the project into percentages based on these areas as illustrated in our analysis below:
- Interviews
- Surveys
- Personas
- Competitive Analysis
- SurveyMonkey
- Affinity Diagram
- Personas
- Conceptual Model
- Process Flows
- Axure